• MBS QUICK FACTS:
  • State-recognized since 1999
  • Accreditation by the German Council of Science and Humanities
  • Study Location: Munich
  • Top Marks in numerous Rankings

Forecast

In an ever-changing global economy, the ability to predict future developments is crucial. Economic forecasts, often simply referred to as forecasts, play a central role in planning and decision-making in companies and public institutions. They help to reduce uncertainties and make well-founded strategic decisions.

Forecast Definition: What is Forecast Planning?

A forecast, or prognosis, is a systematic estimate of future events or conditions based on the analysis of historical data, current trends and other relevant information. In a business context, a forecast often refers to the prediction of variables such as sales, demand, costs, market trends and financial results.
Forecast planning involves the collection and evaluation of past data, the application of statistical and mathematical models and the consideration of expert opinions and external factors. The aim of a forecast is to reduce uncertainty and support decision-making processes by providing the most accurate assessment of future developments.
Effective forecast planning enables companies to prepare for future challenges, identify opportunities and take timely action to secure competitive advantages and ensure long-term success.
Find Similar Financial Lexicon Topics here:

Back to the Financial Lexicon

Difference: Forecast Budget

This table shows the main differences between forecast and budget and illustrates how both instruments are used in corporate planning.

Criterion Forecast Budget
Definition Forecast of future developments Planned financial framework for a specific period
Time horizon Short to medium term (often quarterly) Medium to long term (usually annual)
Data basis Historical data, current trends, external factors Strategic goals, plans, internal targets
Purpose Support for decision-making and planning Determination of financial targets and control
Flexibility Dynamic, regularly updated Static, infrequent adjustments
Use Adaptation to market changes and current conditions Benchmarking, performance monitoring
Accuracy Estimates based on available information Fixed figures based on strategic planning
Example Sales forecast for the next quarter Planned annual sales
Frequency of preparation Regular, often monthly or quarterly Once a year, occasionally half-yearly budgets

Create Forecast: Forecast Calculation

Creating a forecast is a structured process that involves several steps to make well-founded predictions about future developments. Here is a step-by-step guide to creating a forecast:

  1. Objective
    • Determine the purpose of the forecast: Clarify what exactly is to be predicted (e.g. sales, demand, costs).
    • Define the time horizon: Determine the period for which the forecast should apply (e.g. next quarter, next year).
  2. Collect data
    • Historical data: Collect relevant historical data required for the forecast (e.g. sales data from recent years).
    • External data sources: Consider external factors such as market trends, economic indicators and industry data.
    • Current data: Use current information and trends that could influence future development.
  3. Data analysis
    • Data cleansing: Ensure that the data is complete and error-free.
    • Trend analysis: Identify patterns and trends in historical data.
    • Seasonal adjustments: Take into account seasonal fluctuations and other cyclical effects.
  4. Selection of forecasting methods
    • Qualitative methods: Expert opinions, Delphi method, market surveys (useful when data availability is limited).
    • Quantitative methods: Time series analysis, regression models, exponential smoothing, ARIMA models.
  5. Modeling and calculation
    • Model construction: Choose the appropriate forecasting model based on the data and the objective.
    • Perform calculations: Apply the chosen methods to calculate the forecast values.
    • Validation : Check the accuracy of the model by comparison with known data or by cross-validation.
  6. Interpretation and adjustment
    • Interpret results: Analyze the forecast results and understand the underlying assumptions and influencing factors.
    • Make adjustments: Adjust the model if necessary to increase accuracy or incorporate new information.
  7. Creating the forecast report
    • Documentation: Create a report that clearly presents the methods, assumptions, results and recommendations.
    • Visualization : Use charts and graphs to clearly present the forecast results.
  8. Communication and monitoring
    • Communicate results: Share the forecast results with relevant stakeholders.
    • Regular review : Monitor actual developments and compare them with the forecast values to identify deviations and make adjustments if necessary.

By carefully applying these steps, you can create well-founded and reliable forecasts that serve as a valuable basis for strategic decisions.

Forecast terms

Forecast terms

Term Meaning
Forecast Prediction of future events or developments based on historical data.
Time series analysis Analysis of data points collected over regular time intervals.
Trend General direction in which a variable moves over time.
Seasonal effects Recurring patterns or fluctuations in a time series that occur regularly within a year.
Causal model Model that uses relationships between variables to make predictions.
Qualitative methods Forecasting methods based on expert opinions and subjective assessments.
Quantitative methods Forecasting methods based on statistical and mathematical models.
Exponential smoothing Method of forecasting that gives more weight to more recent data points.
ARIMA AutoRegressive Integrated Moving Average, a complex statistical model for time series analysis.
Regression analysis Method for investigating the relationship between a dependent variable and one or more independent variables.
Delphi method Structured communication method in which experts are interviewed iteratively.
Bias Average deviation of the predictions from the actual values, shows the direction of the error.
Tracking signal Measure for recognizing systematic errors in a forecast.
Theil's U statistic Comparison of forecast accuracy with a naive method (no change).
Scenario analysis Analysis that considers various possible future events and their effects.
Capacity planning Planning production capacity based on forecasted demand.
Financial forecasting Prediction of a company's future key financial figures.
Demand forecasting Forecasting future demand for products or services.
Economic Forecast Prediction of economic indicators such as GDP, inflation or unemployment.
Technology forecast Prediction of the development and introduction of new technologies.
Life cycle analysis Evaluation of the entire life cycle of a product or technology.

This list does not claim to be exhaustive, but provides a general overview of the advantages and disadvantages of a mortgage. The individual circumstances and needs of each borrower should be taken into account when deciding for or against a mortgage.

Key figures in forecast controlling

Various key figures are important in Forecast Controlling in order to assess the accuracy and reliability of forecasts and to control the planning process. Here are some key figures that are used in Forecast Controlling:

Forecast Variance

This key figure measures the difference between the forecast and actual values. It shows how accurate the forecasts are and helps to assess the reliability of the forecasting process.

Lead Time

This is the period of time between the creation of the forecast and the time at which the forecast events occur. A shorter lead time enables faster adjustments to market changes and improves the company's ability to react.

Relative Capacity Share

This key figure shows what proportion of the available capacity is required to meet the forecast demand. It helps to plan capacity utilization and ensure that sufficient resources are available to meet the expected demand.

What Forecast Methods are there?

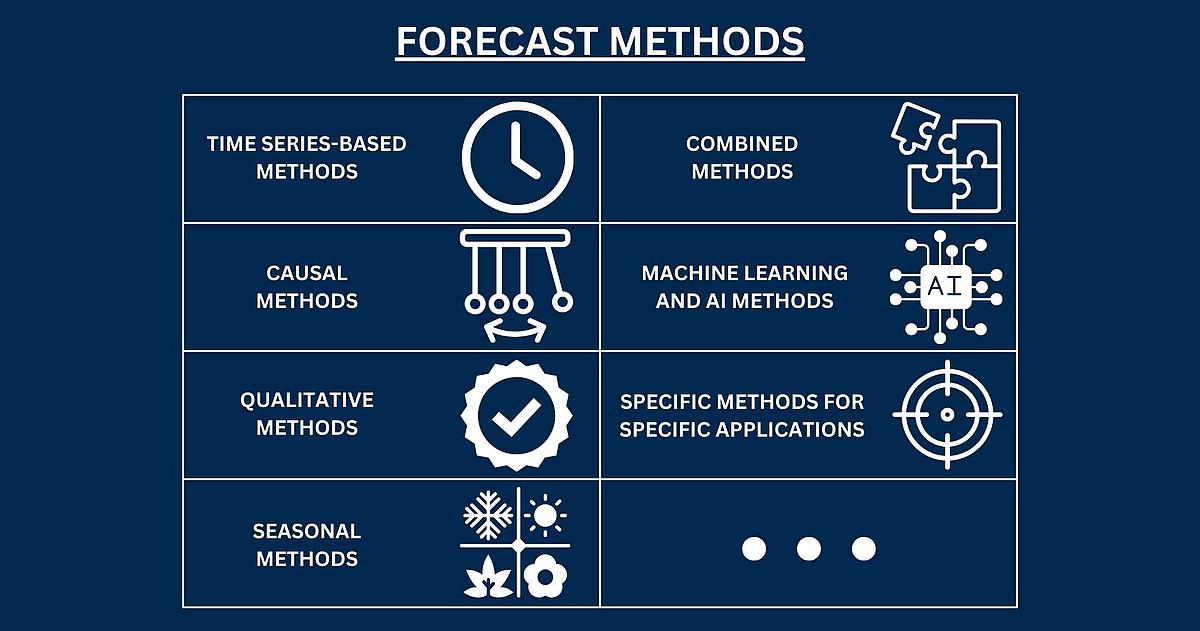
There are numerous forecasting methods that can be used depending on the objective and data situation. Here is an overview of the most important forecasting methods:

Overview: The different Forecast Methods

The following diagram provides an overview of the different forecast methods that exist and are used.

Explanation: The different Forecast Methods

Choosing the right forecast method depends on various factors, including the available data, the complexity of the process to be forecast and the accuracy requirements. It often makes sense to combine several methods in order to improve the accuracy of the forecast.

Seasonal Methods

  • Seasonal moving averages: Averages that take seasonal patterns into account.
  • Seasonal decomposition of time series: Decomposes the time series into trend, seasonal and random components.

Combined Methods

  • Weighted average forecasts : Combines several forecasts into a single forecast.
  • Ensemble methods: Uses a combination of different models to increase forecast accuracy.

Machine learning and AI Methods

  • Neural networks: Complex models that can recognize patterns in large amounts of data.
  • Support Vector Machines (SVM): Models that classify data points into categories and make predictions.
  • Random Forests: Ensemble method consisting of many decision trees.

Specific Methods for specific Applications

  • Life cycle analysis : Predicts the course of a product life cycle.
  • Bottleneck analysis: Identifies bottlenecks in production processes and predicts their effects.
  • Technology life cycle analysis: Evaluates the development and spread of new technologies.

Types of Forecast

There are different types of forecasts that are used depending on the area of application and objective. The choice of the right type of forecast depends on the specific requirements and objectives. Each method has its strengths and weaknesses, and it often makes sense to combine several methods in order to obtain the most accurate forecast possible. Here are some of the most important types of forecasts:

Type of Forecast Definition Methods
Time Series Forecasts Forecasts based on historical data at regular time intervals. Simple moving averages, exponential smoothing, ARIMA
Causal Forecasts Forecasts that use relationships between different variables. Regression analysis, econometric models
Qualitative Forecasts Forecasts based on subjective assessments and expert opinions. Delphi method, market surveys, expert surveys
Seasonal Forecasts Forecasts that take into account seasonal patterns and fluctuations. Seasonal moving averages, seasonal decomposition
Combination Forecasts Use of several forecasting methods to increase accuracy. Weighted average forecasts, ensemble methods
Sales Forecasts Forecasting the future sales figures of a company. Sales data analysis, customer surveys, competitive analysis
Demand Forecasts Forecasts of future demand for products or services. Trend analyses, customer behavior analyses, market segmentation
Economic Forecasts Forecasts of economic indicators such as GDP, inflation or unemployment. Macroeconomic models, leading indicator analysis
Financial Forecasts Forecasts of a company's key financial figures. Financial modeling, scenario analysis
Technology Forecasts Forecasts of the development and introduction of new technologies. Technology lifecycle analysis, roadmapping
Capacity Forecasts Forecasts of future production capacity and utilization. Production data analysis, bottleneck analysis

Forecast Example: Sales Forecast for a Retail Company

Scenario

A retail company wants to forecast sales for the coming year in order to optimize its production and inventory strategies. The company sells seasonal products and has historical sales data for the last five years.


Example Results

Assume that the historical data analysis shows a steady increase in sales of 5% per year on average and a strong seasonality with peak sales in December and a decline in January and February. Exponential smoothing produces the following forecasts for the coming year:

Month Forecasted Sales (in €)
January 50,000
February 45,000
March 55,000
April 60,000
May 65,000
June 70,000
July 75,000
August 80,000
September 85,000
October 90,000
November 95,000
December 120,000

These forecasts help the company to plan its stock levels, adapt marketing strategies and deploy resources efficiently in order to meet expected demand and make the most of sales opportunities.

Find Similar Financial Lexicon Topics here:

Back to the Financial Lexicon

FAQ

What belongs in a Forecast?

A forecast includes historical data, current trends, assumptions about future developments and the models or methods used for forecasting.

What is the difference between Planning and Forecasting?

Planning is the definition of goals and measures for the future, while a forecast is an estimate of future developments based on current data and trends. Planning is therefore more strategic and long-term, while forecasting is more short-term and adaptable.

What is a Rolling Forecast?

A rolling forecast is a dynamic forecasting method in which the forecast period is continuously updated by regularly adding new data and extending the period so that you always have up-to-date and forward-looking planning.

Why Rolling Forecast?

A rolling forecast helps you to react to changes more flexibly and promptly, as it is continuously updated and always looks a fixed period into the future.

How often Forecast?

As a rule, a forecast should be prepared and reviewed on a monthly basis to ensure that forecasts are always up-to-date and accurate.

Interested in studying Business Studies? Request our information material now!


Popular degree programs at the Munich Business School

Our Bachelor's and Master's degree programs provide you with the relevant knowledge and skills you need for a successful career.

Did you find this article helpful? Do you have any suggestions or questions about this article? Did you notice something or is there a topic you would like to learn more about in our dictionary? Your feedback is important to us! This helps us to constantly improve our content and deliver exactly what you are interested in.
Contact editorial office

PAGE-TITLE: Forecast